AOOS Real-time Sensor Map
The Project
This project, initiated by the Alaska Ocean Observing System (AOOS) required a map-based real-time data visualization that harvests, aggregates, and displays information from all of the publicly available atmospheric and oceanographic measurement stations in Alaska.
Challenges
Thousands of automated stations sprawl across Alaska, and each station includes multiple sensors streaming quantitative observations (e.g., temperature, pressure, currents, tides, streams, snow, etc.). Sensor streams come from a variety of data providers, each with their own data processing and streaming standards. Some stations also include current streaming photos (i.e., webcams).
Solutions
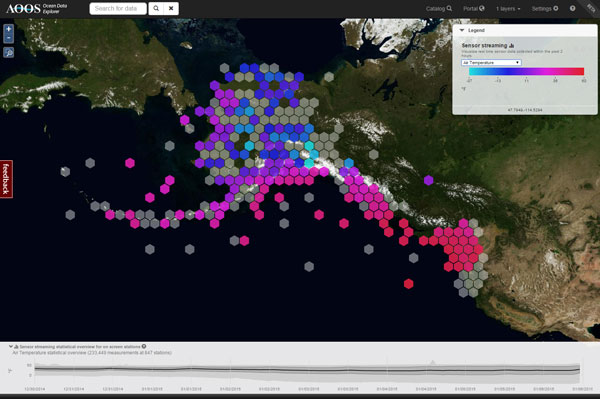
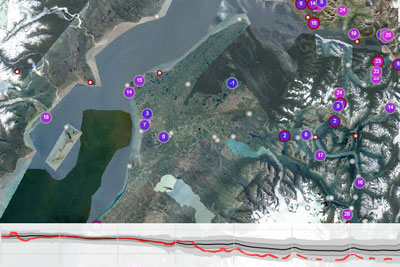
An informative visualization displaying heterogenous in situ measurements required careful, continuous data harvesting and storage, standardization of units and datums, and a lot of optimization. We use hex-binning and summary statistics for broad overviews at low zoom levels, whereas zooming in shows individual sensors and raw data values. The application enables users to quickly find, assess, and download data from specific active sensors. The Alaska Ocean Observing System's Real-Time Sensor Map currently compiles >2,500 land- and ocean-based stations and displays >7,000 live sensors within and around the State of Alaska.
Highlights
Real-time sensors with statistical overviews
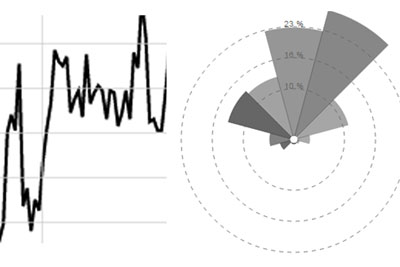
Statistical wind roses calculated on the fly
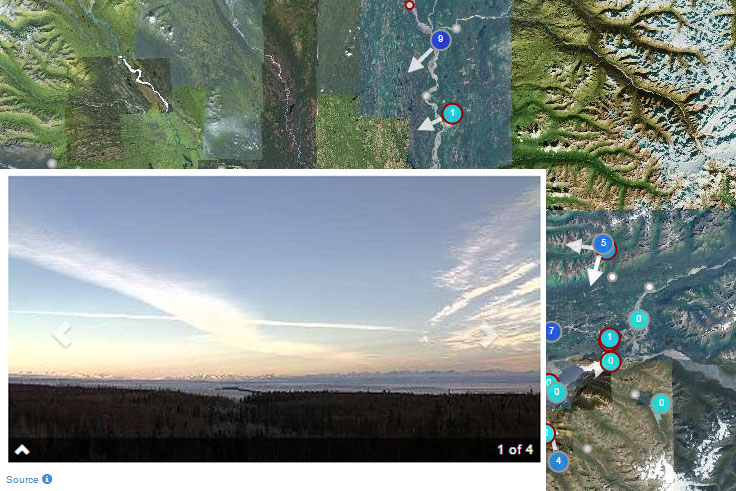
Real-time images from web cams