Building on many years of stakeholder feedback, we have been working on a significant overhaul to the shared infrastructure for our partners data portals, including the Integrated Ocean Observing System (IOOS)’s Environmental Sensor Map, the Alaska Ocean Observing System (AOOS)’s Ocean Data Explorer, the Southeast Coastal Ocean Observing Regional Association (SECOORA) Data Portal, the Central and Northern California Ocean Observing System (CeNCOOS) Data Portal, and more. The updated portal gives users access to new features as well as a revamped design allowing for more data services. With this latest release, the map has migrated to a new framework that is more responsive and tailored to viewing long time series from stations, as well as being updated with more advanced discovery and sharing capabilities. The map offers sophisticated charting abilities, including comparisons between data sources, binning by time, and plotting of climatologies and anomalies. A new feature, data scenarios, show user-created compilations of sensor outputs to spotlight environmental events or geographic locations. In a later version, ocean profiling sensors will show depth charts, interpolation via kriging, and 4D interactive charts.
Users may now opt-in to the beta version (v2.3) when visiting the landing pages for these portals, where the old version will still be available. Incremental changes will be made to the beta version through March 2018, each with additional updates and portal enhancements. Feedback on the new interface and features will be integrated into the final, operational version. With these new features, we are hoping to deliver a more powerful tool for users to explore relationships and trends among data assets within these regions.
To check out the latest version visit:
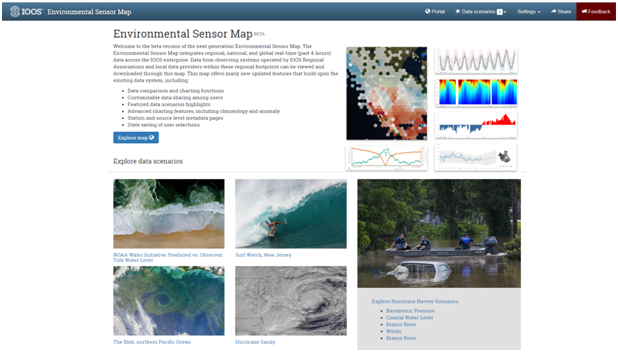
A screenshot of the landing page to the new, beta Environmental Sensor Map. Users can explore data through the map or explore spotlighted data ‘scenarios’.
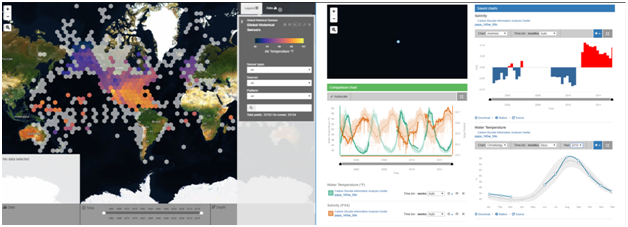
New map interface with palette control (left), and comparison charts between different sensors and parameters (right). Data charts offer user selection of climatology or anomaly views for longer timeseries (>3 years).
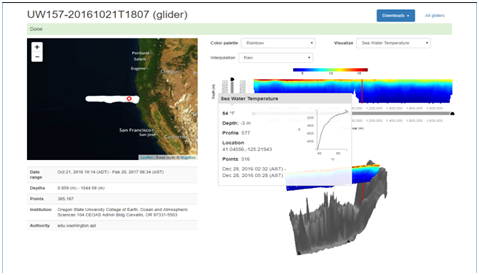
Station level page displaying profile data, including: depth plots, interpolation using kriging, and 4D charting.